ASTR/PHYS 328/428 Homework #4
1. Distance Errors
Use differential calculus and propogation of errors to show that, for small uncertainties in distance modulus, the relative distance error is given by
Given this relation, explain why the surface brightness fluctuation technique (with an uncertainty of ~ 0.1 mag) can do such a good job describing the internal structure of the Virgo Cluster, but is not very effective for getting the internal structure of the Coma cluster.
2. The Distance to M101
Here is a datafile containing photometry of point sources detected in our Hubble imaging of the outskirts of M101's disk (Mihos+18). We will use this to get a TRGB distance to M101. The magnitudes use the Hubble filter system, but for our purposes you can think of the F606W magnitude as a V magnitude, and the F814W magnitude as an I magnitude.First make a color-magnitude diagram (I vs V-I) with all the sources plotted (use teeny tiny points!). Like all color-magnitude diagrams, your plot should have brighter stars at the top, and redder stars at the right. Now just eyeball the diagram and make an estimate of where you think the RGB tip is, both in apparent magnitude and in color. You may want to "zoom in" your axes so that you can see the tip a bit more clearly. There are sources brighter than the RGB tip -- what do you think these sources are? There are sources bluer than the tip -- what do you think these sources are? We can define an RGB selection box using the following criteria: - stars with magnitudes in the range I = 26.8 - 24.2, and
- stars with colors within +/- 0.1mag of the "RGB spine", defined as (V-I)RGB = -0.19*I + 5.9
Select these stars from the dataset and replot them on your CMD in a different color just to verify you've successfully selected RGB stars. Then make an RGB luminosity function, counting the number of these stars as a function of magnitude, using magnitude bin sizes of 0.075 mags. Plot this (like all luminosity functions, you should be plotting logN vs m), and examine your luminosity function to make a better estimate of the RGB tip. (Note: you don't need to do any quantitative edge-modeling, but do your best "by eye" estimate of where you think the tip is based on the luminosity function). Give both your estimate of the tip magnitude and an uncertainty.
Now look at the color of the RGB tip, and use that color to figure out what the absolute magnitude of the tip should be (use the relationship shown in the class notes). From this, estimate the distance to M101 and its uncertainty.
Comment on what you think the major systematic sources of uncertainty are in your estimate, and how you might improve on them.
3a. The Coma Cluster (Everyone BUT Jakob, Julia, and Nick)
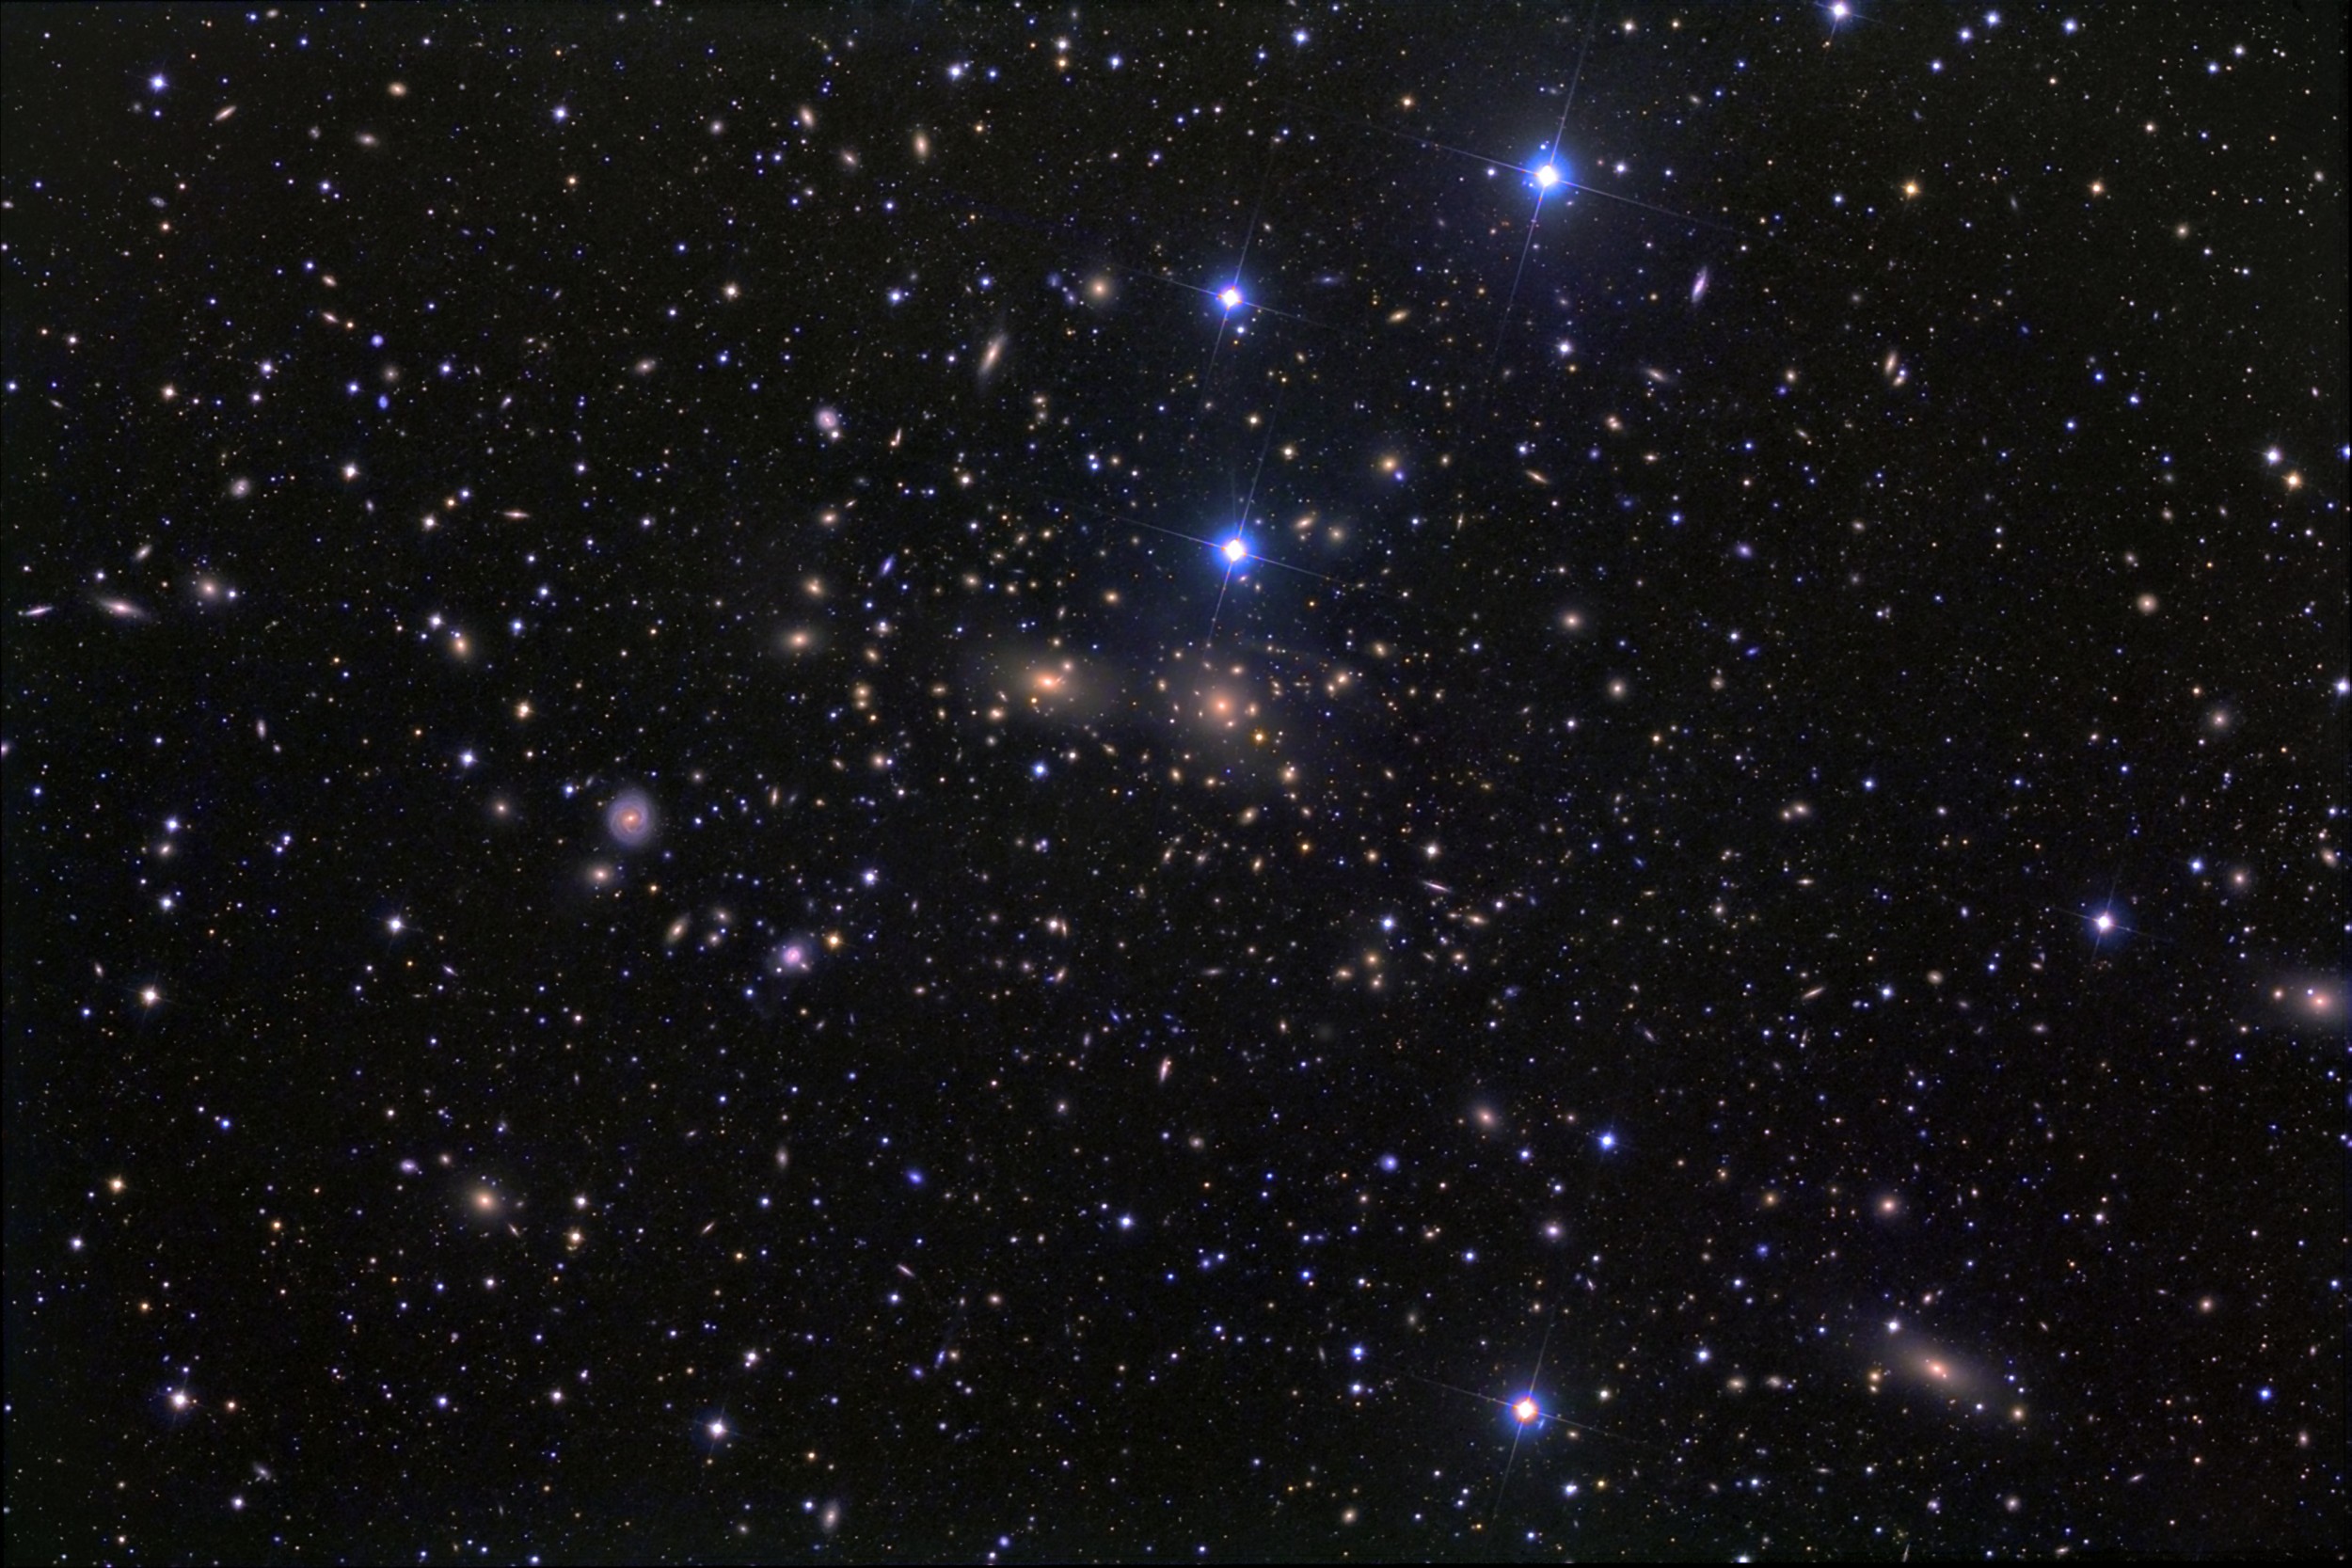
We are going to find the mass of the Coma cluster of galaxies. For this problem, adopt a Hubble constant of H0=72 km/s/Mpc.First, here's an image of Coma, so that you know what you are studying. And here is a dataset of galaxies in a 6x6 degree field around the Coma cluster (from Doi+95). It contains- name: galaxy ID number
- x & y: position relative to the center of Coma (defined by NGC 4886), measured in arcminutes
- cz: the observed radial velocity in km/s. cz=0 means no measurement.
- Bt: apparent blue (B) magnitude
Make an x,y plot of the galaxy distribution (and make sure the axes on your plot have equal aspect ratio, since you're making a picture!).
Make a histogram of the radial velocity of all the galaxies (use bins with width of 250 km/s, and don't include galaxies without velocity measurements when making your histogram!). Reject outliers in the velocity distribution (explain how you decide this), then calculate the mean velocity and velocity dispersion of the galaxy sample. From your data, how far away is Coma?
Now construct a preliminary sample of "Coma members" by selecting a subset of galaxies with radial velocities within +/- 2.5 sigma of the cluster mean velocity (and dont include galaxies that have no velocity measurement).
Sum up the total blue luminosity (in solar luminosities) of all the galaxies in your Coma cluster galaxy sample. (For reference, the absolute blue magnitude of the Sun is MB=+5.5.) Then figure out the radius (in arcminutes) which contains half this total luminosity. This is called the half-light radius. What is the half-light radius of Coma in arcminutes and in Mpc?
Now create your final sample of Coma member galaxies by selecting a subset of galaxies that have radial velocities within +/- 2.5sigma of the cluster mean velocity, and also lie at a projected radius that is smaller than twice the half light radius.
Use this final sample of Coma galaxies to estimate of the mass of Coma (in solar masses). To do this, use the projected mass estimator of Heisler+85:
where N is the number of galaxies used in your estimate, vi is the velocity of each galaxy (after subtracting out the mean cluster velocity), and Ri is the projected distance (in physical units, not angular) of each galaxy from the cluster center.
If the stars in the Coma cluster galaxies have a stellar mass-to-light ratio of (M/L)=3 Msun/Lsun, what is the total mass of stars in the Coma cluster (assume that your sample of galaxies represents about half the total light of Coma)? X-ray measurements indicate that Coma has a hot gas mass of about 3x10¹⁴ Msun. Given this, what fraction of the Coma cluster mass is in dark matter? If the Coma cluster is a fair sample of the universe, what is the ratio Omega_baryon / Omega_matter?
Again, comment on what you think the major systematic sources of uncertainty are in your estimate, and how you might improve on them.
3b. Stickman (ASTR 428, plus Jakob, Julia, and Nick)
Here is a dataset from the
CfA redshift survey, containing sky coordinates (RA and dec), B
magnitudes, and redshifts (cz, in km/s) for a sample of galaxies. Use
it to recreate the "Stickman" figure shown in class. It's easiest to
convert the angular coordinates and redshift (RA, dec, cz) into
cartesian X,Y coordinates with units km/s. Since the data was taken in
a slice of declination, all declination values are roughly the same,
and you can just use the RA as your main angular coordinate.
Note on coordinates:
- Right ascension: an angular
coordinate in units of time: hours, minutes of time, seconds of time.
To convert to degrees, first convert to decimal hours, then remember
that there are 15 degrees in an hour.
- Declination: an angular coordinate in units of degrees, minutes of arc, seconds of arc.
Estimate the size of the voids (underneath Stickman's
armpits), in both km/s and Mpc. Let's say that I told you that galaxies
formed in the voids early on in the Universe, but have since moved out
due to peculiar velocities. If typical peculiar velocities are ~ 600
km/s (like that of our galaxy with respect to the CMB), how long would
it take for galaxies to clear the void (express your answer both in
years and in terms of the fraction of the Hubble time [defined as 1/H0])?
Show how both your answers depend on the Hubble Constant (in other
words, if you decided to use a different value for the Hubble constant,
how do your answers change?). Is my idea of galaxy formation in voids
any good?
4. Structural overdensities
As we discuss the growth of structure in the universe, we will often parameterize it as an "overdensity" delta, defined by mass density as
- Using the current "best values" for the cosmological parameters, calculate the average density of matter at the present time.
- What is the expected value of delta for a sufficiently large volume of the local universe? What would it be for an absolutely empty volume of space?
Now do some research* to find out properties (masses/sizes) of the following objects, and work out their overdensities:
- The globular cluster M13
- The Milky Way Galaxy
- The Local Group of Galaxies
- The Coma Cluster of Galaxies
In each case, explain whether (and why) your number is an upper limit, a lower limit, or a reasonably good estimate. Also cite your information sources (in ApJ style, i.e., Smith et al 2007, ApJ, 261, 15) and explain how they derived the information you used.* Your information sources should be either refereed journal articles or research-grade books. Wikipedia, SEDS, and non-technical textbooks or popular books do not qualify. Remember a good place to access research literature is the ADS Abstract Service.
5. Descriptive Essay
Describe the two "direct" methods for estimating the Hubble constant: gravitational lensing and the Sunyaev-Zeldovich effect. For each one, explain the physics behind the method, describe what observational data is needed, and how that data is used to constrain H0. Also discuss major sources of systematic uncertainty in each method.
6. ASTR 428: Research Presentation outline
I want a good, well researched outline of your project, along with a quality reference list. Let's say that I was doing a project about using the Sunyaev-Zeldovich Effect to get H0. Here are examples of outlines:


