The Hertzprung-Russell Diagram
Ejnar Hertzprung (1905) published tables of luminosities
and colors of stars, noting certain correlations. In 1913, Henry Norris
Russell presented similar data in a diagram (now known as the Hertzprung-Russell
diagram)
The H-R diagram turns out
to be perhaps the most important tool in astronomy. It helps
us determine ages, distances, and chemical composition (metallicity),
of stars and nearby galaxies.
A more modern (observer's)
H-R diagram looks something like this:
 An ultramodern observer's H-R diagram (called a Hess
diagram) from Dennis
Zaritsky:
An ultramodern observer's H-R diagram (called a Hess
diagram) from Dennis
Zaritsky:
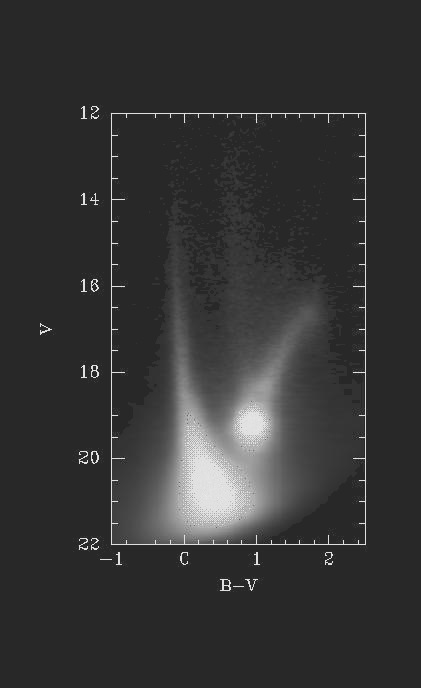 Note that the vertical axis here is apparent
magnitude. For this to make sense, all stars on this plot must
lie at roughly the same distance (why?). That is the case
here: this is a hess diagram for the Large Magellenic
Cloud, a small dwarf galaxy which is about 50 kiloparsecs away...
Note that the vertical axis here is apparent
magnitude. For this to make sense, all stars on this plot must
lie at roughly the same distance (why?). That is the case
here: this is a hess diagram for the Large Magellenic
Cloud, a small dwarf galaxy which is about 50 kiloparsecs away...
We can also make a theorist's
H-R diagram which looks something like this:
Where do those lines of stellar radius come from?